The sales and revenue reports turn your day-to-day transactions into a clear picture of how the business is doing — what sold, how income is trending, and where your margins really are.
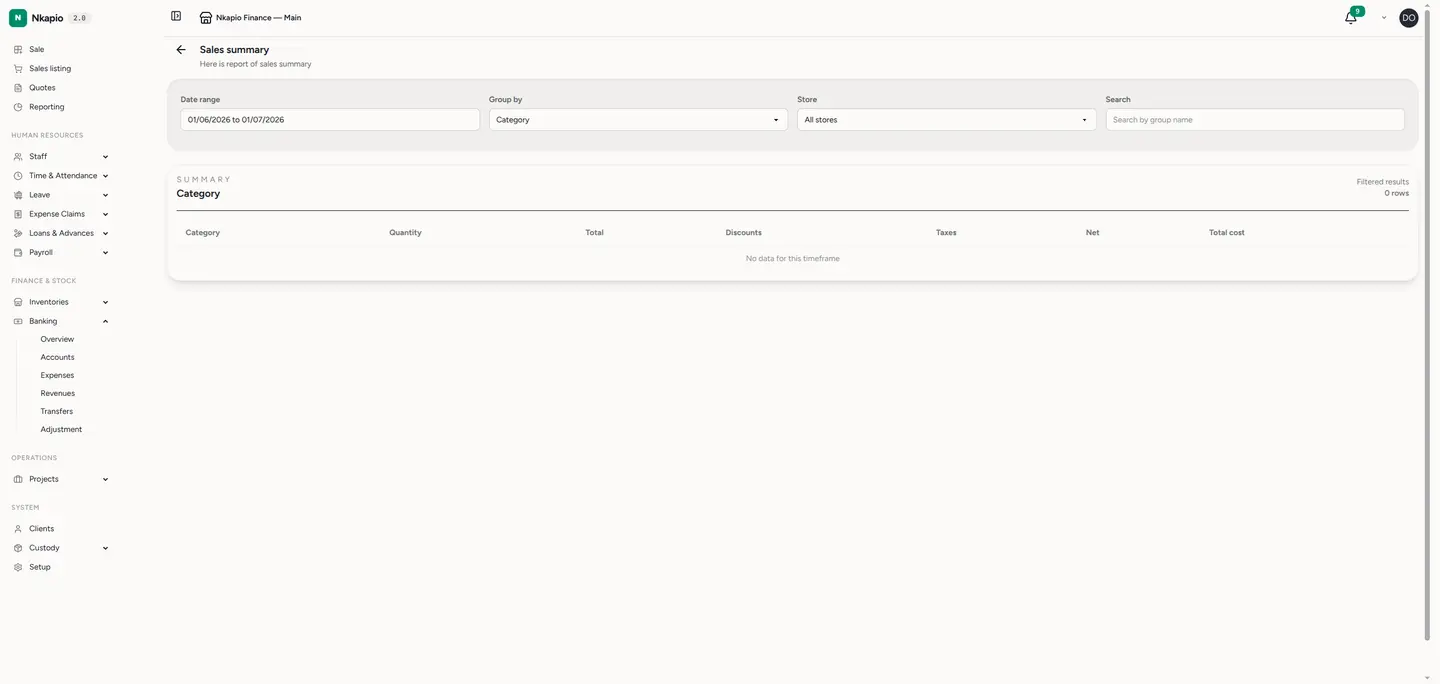
Step 1 — Filter the sales summary
Open the sales report. Set the date range, and filter by staff, client or payment type. The summary updates to show totals, counts and averages for exactly the slice you care about.
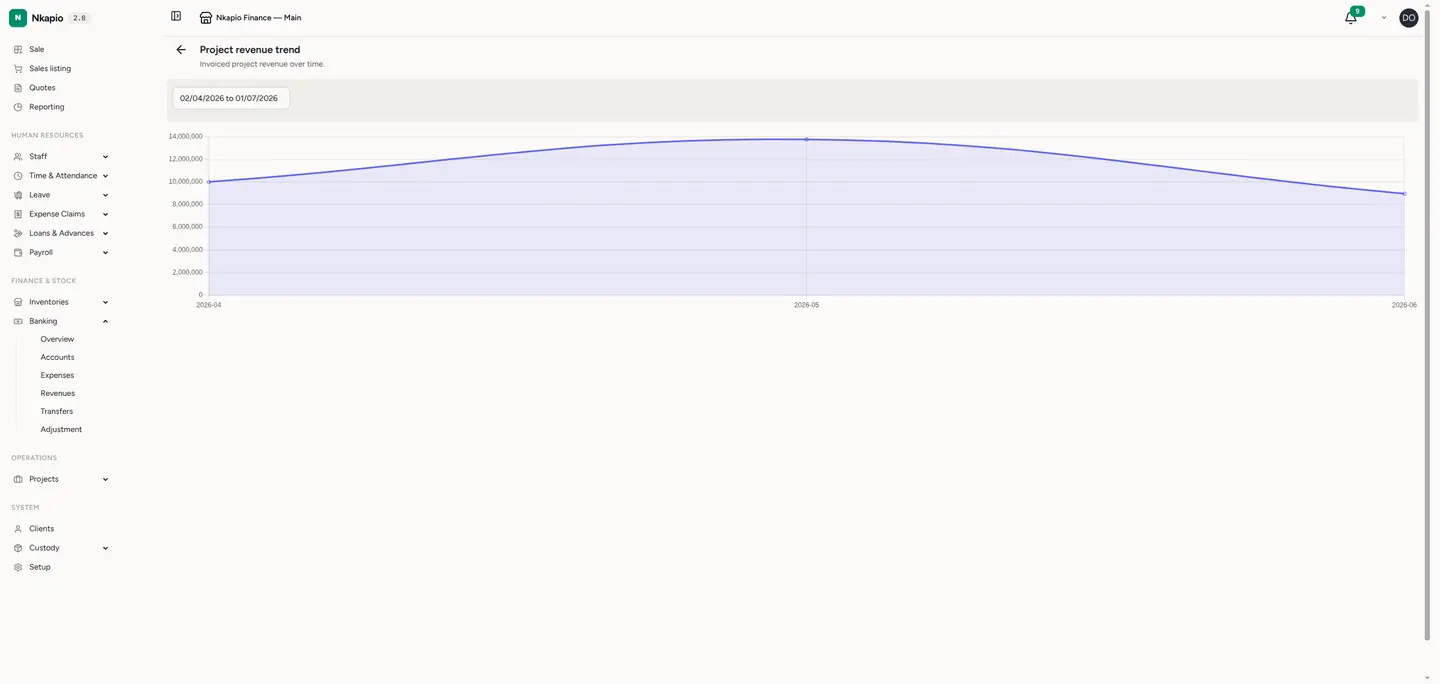
Step 2 — Read the revenue trend
Switch to the revenue trend view. The chart plots income over time so you can spot busy and quiet periods at a glance and compare one month against another.
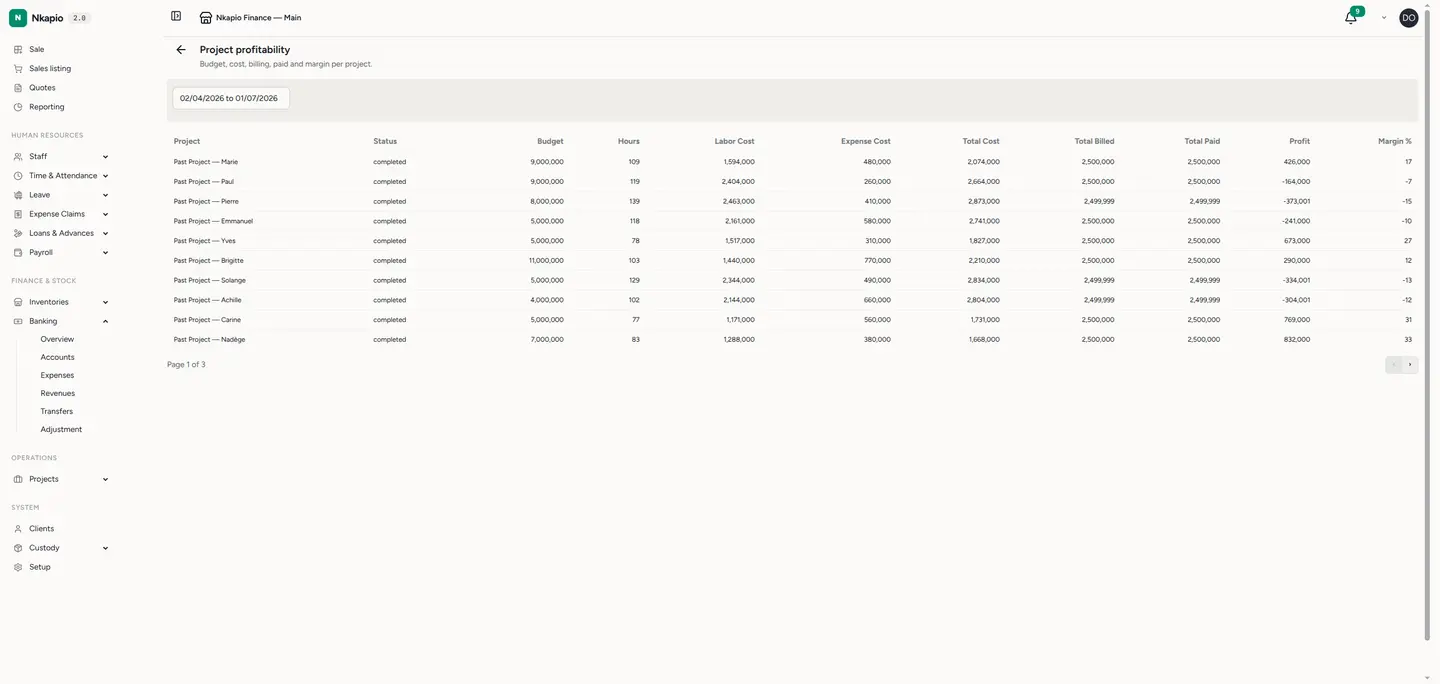
Step 3 — Check profitability
Open the profitability view to see revenue against cost per item or service. This tells you which offerings actually make you money — not just which ones sell the most.
Tip: export any report for your accountant or to build your own analysis in a spreadsheet.